How to Build a Swing-Trading Plan Before Entering a Position
Decide the setup, entry, stop, position size, and profit plan while your money is still safely outside the trade.
Most bad trades do not start with a bad stock. They start with a trader entering before deciding what would prove the idea right or wrong.
The chart looks good. Price is moving. You do not want to miss it, so you buy first and promise yourself that you will work out the details afterward.
Then the trade pulls back. Was that a normal retest or has the setup failed? Should you add, hold, or get out? If the stock moves higher, where should you take profit?
Without a plan, every small move forces another decision while money is on the line. That is exactly when emotions tend to take over.
What is a swing-trading plan?
A swing-trading plan is a written outline for one specific trade. It defines:
- Why you are interested in the setup
- What must happen before you enter
- Where the trade is invalidated
- How much money you are willing to risk
- Where you may take profits
- What could change the trade after entry
Think of it as your decision-making work completed in advance. You cannot control whether the trade wins. You can control whether the trade makes sense, whether the risk is acceptable, and whether you follow your process.
Step 1: Start with the market environment
Before looking at an individual stock, take a quick look at the broader market. Is it trending higher, trending lower, or moving sideways? Is breadth healthy, or are only a few large stocks holding up the indexes?
The MaicaTrades Dashboard brings those questions into one view. Start with the Market Score, then check Market Breadth and Market Pulse. You are not looking for a prediction. You are checking whether conditions support the kind of trade you want to take.
- In a strong market, you may be more comfortable holding a breakout through a normal pullback.
- In a mixed market, you may reduce your position size or take profits sooner.
- In a weak market, a bullish setup may require stronger confirmation before it is worth taking.
A good stock can still struggle when the overall market is working against it.
Step 2: Write down the reason for the trade
“The stock looks strong” is not a complete trade idea. Your reason should be specific enough that another trader could look at the chart and understand what you see.
The stock is in an uptrend, pulled back to the rising 20-day moving average, and is forming a tight base above support. I am looking for a move above the base with stronger volume.
Or: price broke through resistance, returned to test the breakout level, and held. You are looking for a higher low and a move back above the previous session's high.
This identifies the actual setup and gives you something useful to review later.
Step 3: Define the entry trigger
A setup and an entry are not the same thing. You may like the chart, but what exactly must happen before you put money at risk?
- A break above a defined resistance level
- A successful retest followed by a higher low
- A move above the previous day’s high
- A bounce from the 20-day moving average
- A strong reversal candle near support
- A breakout supported by above-average volume
Instead of writing “Enter if it looks strong,” write “Enter above $52.40 if price holds above the breakout level.” The second version leaves much less room for an emotional decision.
Draw the entry, stop, and potential targets before placing an order. You can map the complete setup on TradingView and see whether the potential reward makes sense compared with the risk.
Do not treat the planned entry as a command. If the stock gaps far above it, the risk-to-reward calculation may no longer make sense. Missing a trade is usually cheaper than chasing one.
Step 4: Decide where the idea is wrong
Your stop should be tied to the chart, not to the amount of pain you can tolerate. Ask: What price action would prove that my original idea is no longer valid?
If you are trading a breakout and retest, the setup may fail when price closes back below the reclaimed level. If you are buying a pullback to the 20-day moving average, it may fail when price loses that average and breaks the recent swing low.
If your planned entry is $52.40 and your stop is $50.90, you are risking $1.50 per share.
Step 5: Calculate the position size
Once you know the entry and stop, calculate how many shares fit your risk limit.
The calculation is $75 divided by $1.50, which equals 50 shares.
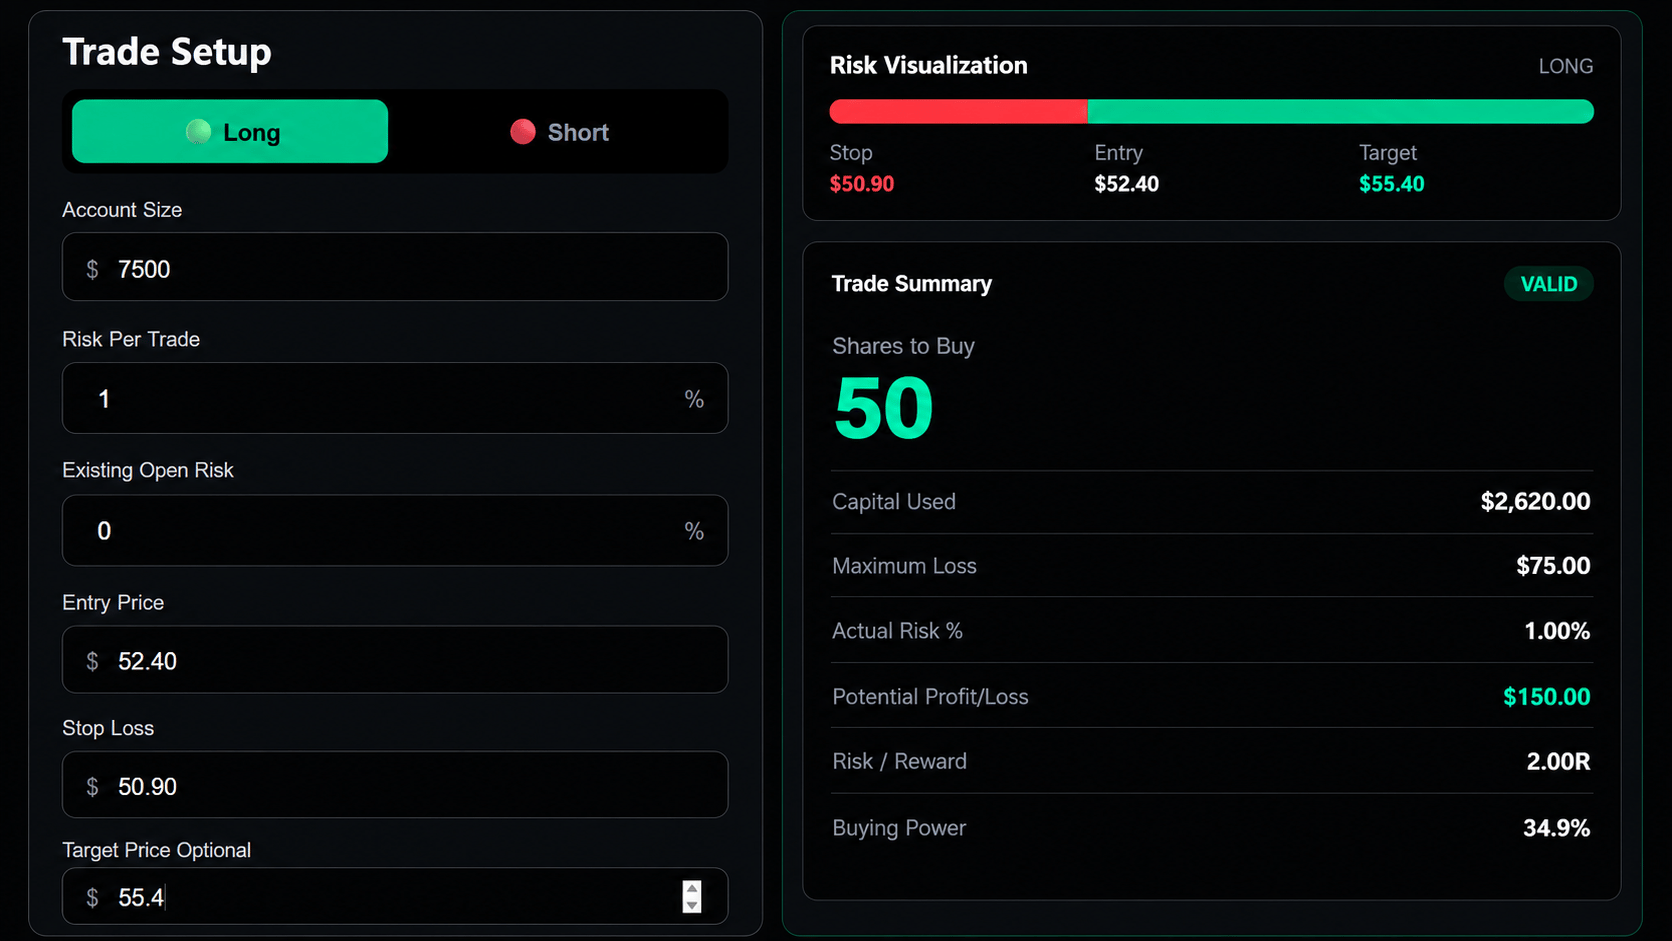
The MaicaTrades Position Size Calculator can work out the position size from your entry, stop, and maximum account risk.
Position size comes last. You do not buy 100 shares because that is your usual size and then force the stop to fit. The chart determines the stop, your risk limit determines the position size, and the position size keeps one bad trade from doing serious damage.
If you trade options, the principle is the same. Decide the maximum amount you can lose before entering, account for expiration and implied volatility, and avoid buying more contracts simply because they appear inexpensive.
Step 6: Identify realistic profit areas
You do not need to predict the exact top. You need to know where sellers may appear and whether the potential reward justifies the risk.
- The next resistance level
- A prior swing high
- The top of a trading range
- An all-time high
- A fixed multiple of your initial risk
Using the earlier example, the risk is $1.50 per share. If the next meaningful resistance is only $1 above the entry, risking $1.50 to make roughly $1 may not be attractive. If resistance is $4 higher, the trade has more room to work.
You can also scale out—perhaps taking part of the position off at the first resistance level and allowing the remainder to work toward a larger target. Decide this before the trade becomes profitable.
Step 7: Check upcoming catalysts
Before entering, check the calendar. Is the company reporting earnings soon? Is a Federal Reserve decision, inflation report, or major industry announcement scheduled during your expected holding period?
The MaicaTrades Economic Calendar can help you check the week's major market-moving events before committing to the trade.
A chart can look perfect and still gap sharply after unexpected news. Some traders intentionally hold through catalysts, but that should be a planned decision—not a surprise discovered after entering.
A complete swing-trade plan example
Market environment: The broad market is constructive, but momentum has slowed. Position size will be slightly smaller than normal.
Setup: ABC is in an uptrend and recently broke above $80 resistance. Price has pulled back for three sessions and is holding the breakout area near the rising 20-day moving average.
Entry trigger: Enter above $81.20 after price forms a higher low. Do not enter if the stock gaps above $82.50.
Stop: $78.90, below the breakout level and recent swing low.
Risk per share: $2.30.
Maximum account risk: $92.
Position size: 40 shares.
First profit area: $85, near the recent high. Consider selling one-third of the position.
Second profit area: $88–$90 if momentum and the market remain supportive.
Catalyst check: No earnings scheduled during the next two weeks. Inflation data is due Friday morning.
Invalidation: Exit if price breaks the planned stop. Reassess before Friday’s inflation report if the trade has not made progress.
Your pre-trade checklist
A plan will not eliminate losing trades
Even a well-planned trade can fail. The purpose of the plan is not to avoid every loss. It is to prevent one uncertain chart from turning into an oversized, unmanaged position.
The goal is not to know what the market will do next. The goal is to know what you will do next—whether the trade moves in your favor, moves against you, or never reaches your entry.
That is what turns a chart idea into a trade you can actually manage.
Educational content only. Nothing in this article is financial advice or a recommendation to buy or sell any security. Trading involves risk, including the possible loss of principal.